Analytics Engineering · Applied Statistics

From raw data to the next decision.

I started in data building Power BI reports, and kept moving toward what sits underneath them: clean models in dbt and PostgreSQL, then the statistics to explain why numbers move and forecast where they are going. Today I work across that whole path.

Selected work

Projects

My production work is under NDA, so these projects rebuild the same kind of problems on public or simulated data. Everything is reproducible from the code.

dbt · DuckDB · SQL · GitHub Actions

Olist e-commerce analytics in dbt

A layered dbt project that turns nine raw files from a Brazilian marketplace (~100k orders) into tested facts, dimensions and analysis-ready marts.

  • Staging → intermediate → marts, with every business rule defined once
  • 85 data tests; known source defects monitored as warnings with a ceiling
  • Business glossary, metric dictionary, exposures and CI on every push
Finding: orders delivered on time average 4.3 / 5. Late orders average 2.3, and the share of 1–2 star reviews jumps from 9% to 62%.
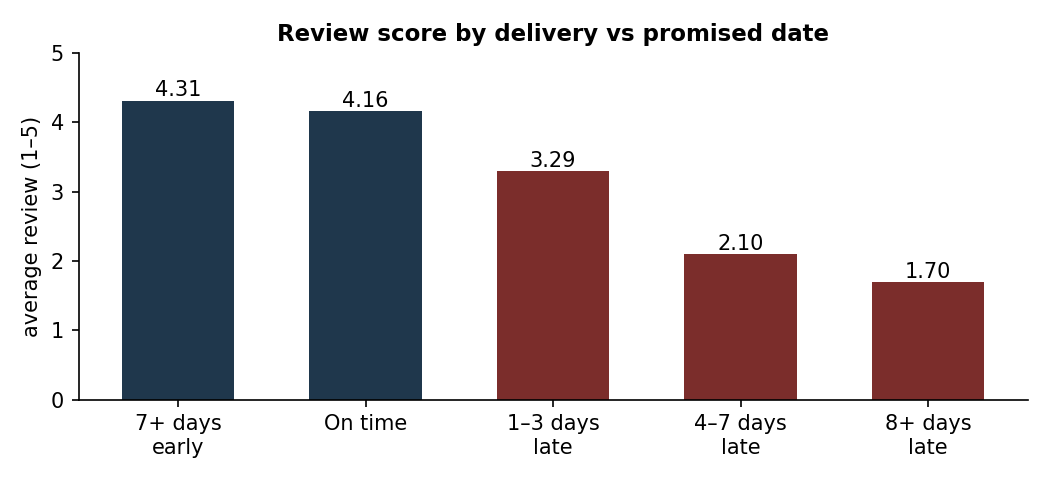
Bar chart: average review score falls from 4.31 for orders 7+ days early to 1.70 for orders 8+ days late.
Review score by delivery date vs the date promised at checkout.
Python · statsmodels · logistic regression

Is the top sales rep better, or just better supplied?

A decision report on 60k leads and 18 reps. It separates what a rep is given from what a rep does, and turns that into a recommendation and a pilot plan.

  • Maturity window chosen from the time-to-conversion distribution
  • Sensitivity analysis and a step-by-step decomposition of the top rep's lead
  • Temporal validation, scenario projections and pilot sample size
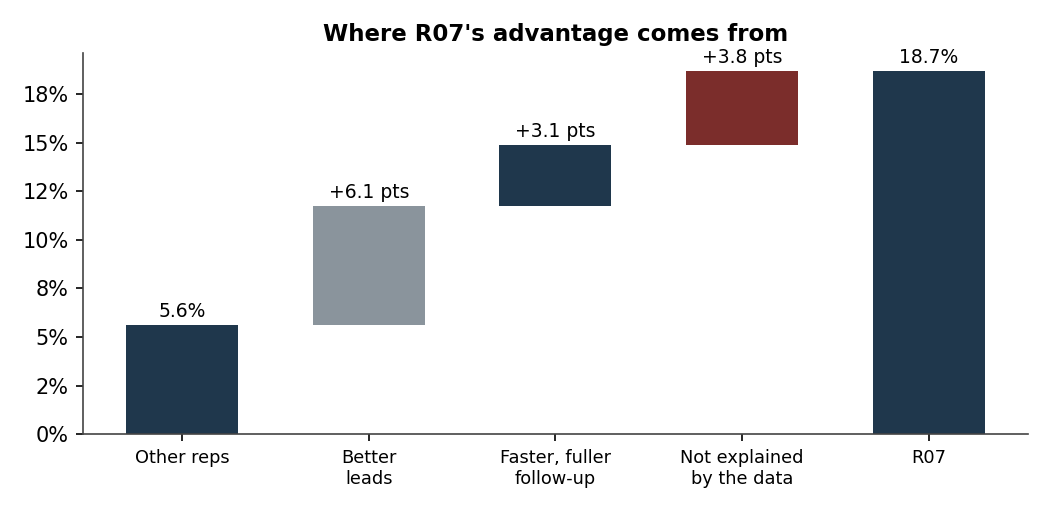
Finding: the top rep's 3.3× advantage is half lead mix. The transferable part is speed of first contact, worth a projected +33% conversion if the whole team adopts it.
Waterfall chart: other reps 5.6%, plus 6.1 points from better leads, 3.1 from faster follow-up, 3.8 unexplained, reaching 18.7%.
Because the data is simulated, the method is checked against the hidden skill that generated it. The adjusted ranking finds the truly best rep; the raw ranking does not.
BI & visualization

Dashboards

Where I started, and still use every week: turning a data model into a view a manager can read in ten seconds.

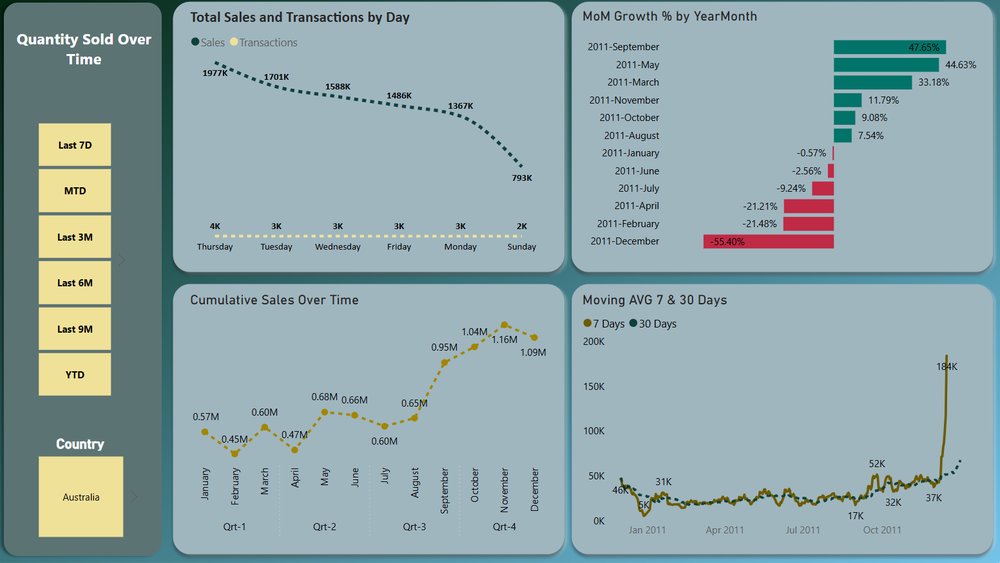
Power BI dashboard with period filters, sales by weekday, month-over-month growth, cumulative sales and 7 and 30 day moving averages.
PostgreSQL · Power BI · DAX

E-commerce sales and returns

540k invoice lines cleaned in PostgreSQL, then a Power BI model with a date table: real sales vs returns, repeat vs one-time buyers, time between purchases.

View project →
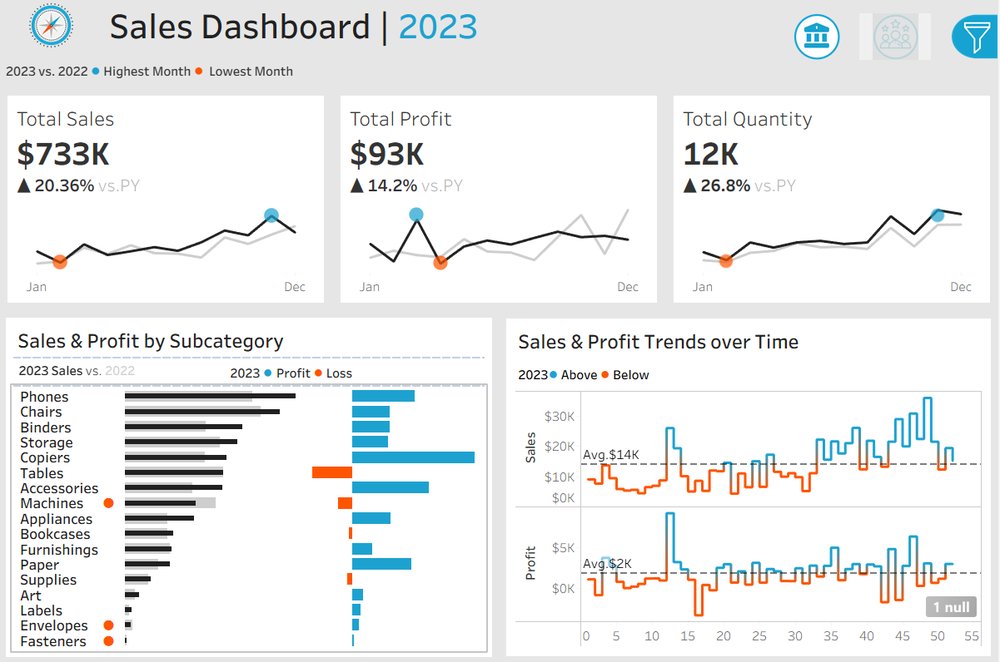
Tableau sales dashboard comparing 2023 with 2022: KPI cards with sparklines, sales and profit by subcategory, weekly trends above and below average.
Tableau · data modeling

Sales performance, year over year

Four related tables modeled in Tableau. KPI cards against last year, profit and loss by subcategory, and weeks above or below average.

View project →
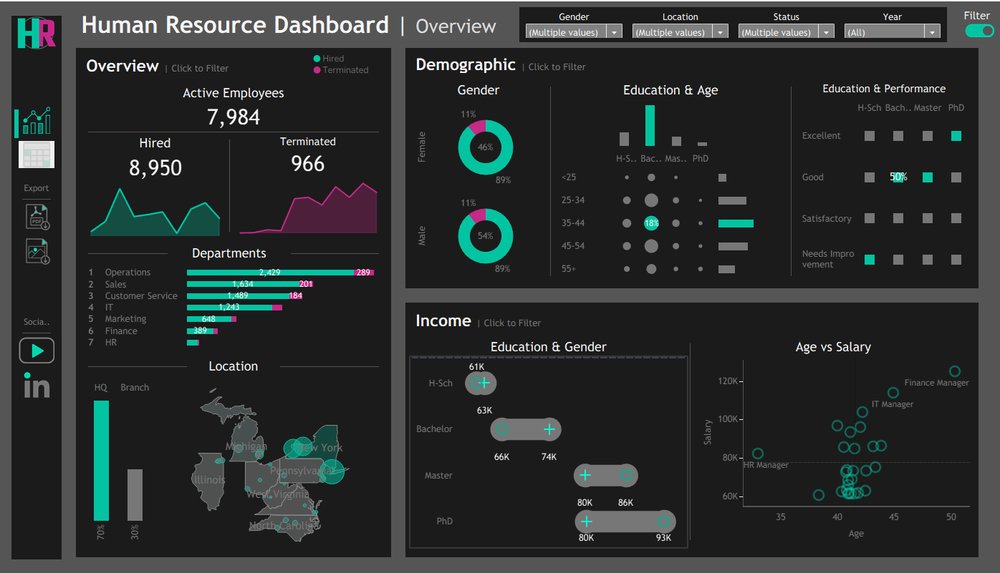
Tableau HR dashboard: active, hired and terminated employees, departments, demographics, education and income.
Tableau · Python (synthetic data)

HR workforce overview

Hiring, attrition, demographics and pay across ~9k employees on generated data, with filters by location, status and year.

View project →
How I work

Approach

The same three habits run through my production work and these projects.

Define it once

Agree what a metric means with the people who use it, write the rule in one model, and let every dashboard inherit it.

Test the claim

Before a number drives a decision: compare like with like, validate on later data, and say how much the data cannot explain.

Make it usable

End with something a manager can act on: a dashboard with targets, a what-if model, a sized pilot.

Background

Experience

Feb 2026 – present

Data Analyst

Serita Clinic

Set up and maintain the dbt project on PostgreSQL behind finance, treatment and patient-funnel reporting. Built demand forecasting, call-center conversion analysis and Metabase dashboards, including a what-if funnel for managers.

Dec 2023 – May 2025

Data Analyst & Operations Specialist

Trend Marketing Solutions

Power BI reporting for Filmnet, contract reporting for Snapp Market, and a Microsoft Dynamics CRM rollout. KPI work behind pricing changes that helped double sales ROI.

Nov 2020 – Oct 2023

Head of Operations

Trend Marketing Solutions

Started the company's first operations department and led a team of six.

Skills

SQLPostgreSQLdbtData modeling StatisticsRegressionForecastingExperiment design Power BIMetabaseTableauGitPython (basic)

Education

M.Sc. Nuclear Engineering
Sharif University of Technology

B.Sc. Chemical Engineering
Arak University

English: fluent (TOEFL iBT 100) · Persian: native

Contact

Get in touch.

For analytics engineering, data analysis and analytics consulting work, email is the fastest way to reach me.